
The problem that stalled my pipeline
I was asked to set up a performance pipeline: run load tests in CI, then decide pass or fail based on SLOs — things like:
- p99 latency under 500 ms
- Error rate under 1%
- Throughput above 25 req/s
Simple enough in theory. But when I started looking for a JMeter-native way to close that loop, I hit a wall.
.jtl result files. It has no built-in concept of SLO thresholds, pass/fail gates, or sharable summary reports. Everything downstream is either a custom script or another tool entirely.
The options I found felt like workarounds:
| Option | The catch |
|---|---|
Parse .jtl yourself | Brittle — every team reinvents it differently |
| Use Taurus | A whole new toolchain on top of JMeter |
| Write a CI script | Nobody wants to own that script 6 months later |
I didn’t want to reinvent this every project. So I decided to solve it once, inside JMeter — as a plugin.
What I built: PerfSage SLO Reporter
PerfSage SLO Reporter is a JMeter Backend Listener plugin. You add it to your test plan like any other listener — no extra step in your pipeline, no external tool.
When the test finishes, it:
- Evaluates your SLO thresholds (latency, error rate, throughput)
- Generates an HTML report you can open, attach, or embed
- Writes a JSON summary for CI parsing
- Flags anomalies with built-in analysis hints — no API key required
Setting it up in JMeter
Here’s what the Backend Listener config looks like inside a real test plan:
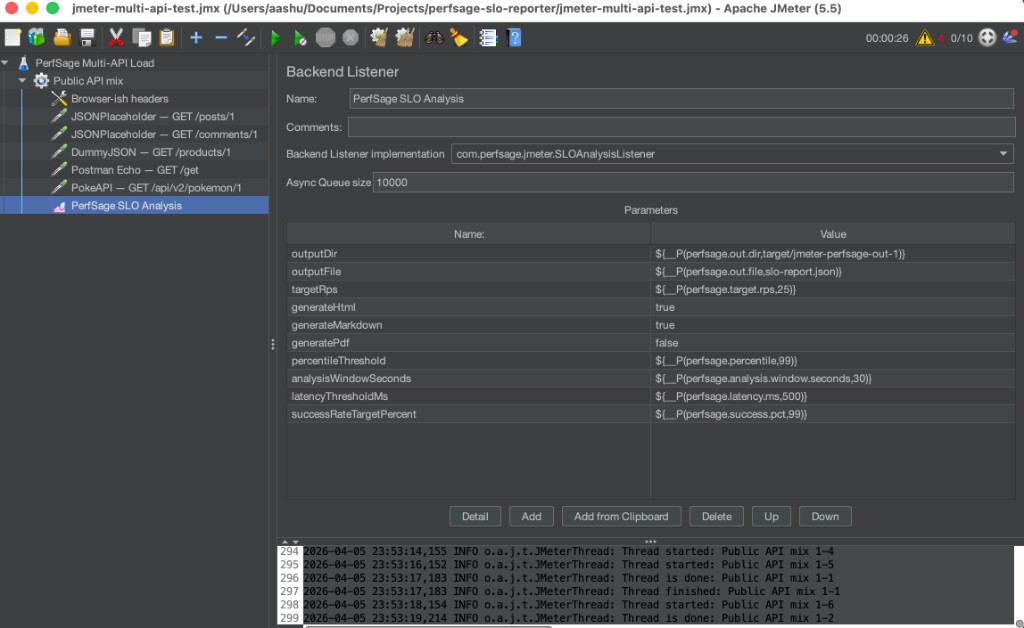
Key parameters are all parameterized with JMeter properties so you can override them from the command line:
latencyThresholdMs     → ${__P(perfsage.latency.ms, 500)}
successRateTargetPct   → ${__P(perfsage.success.pct, 99)}
targetRps              → ${__P(perfsage.target.rps, 25)}
percentileThreshold    → ${__P(perfsage.percentile, 99)}
That means the same .jmx file works both locally and in CI — no edits needed between environments.
The validation run: 5 real public APIs
To verify the plugin works end-to-end, I ran it against a mix of 5 real, publicly available API endpoints:
/get/comments/1/posts/1/products/1/api/v2/pokemon/1Test parameters: 1,000 total samples, 10 concurrent threads, p99 latency SLO of 500 ms, throughput target of 25 req/s, success rate target of 99%.
The results
Here’s the actual HTML report PerfSage generated after the run:
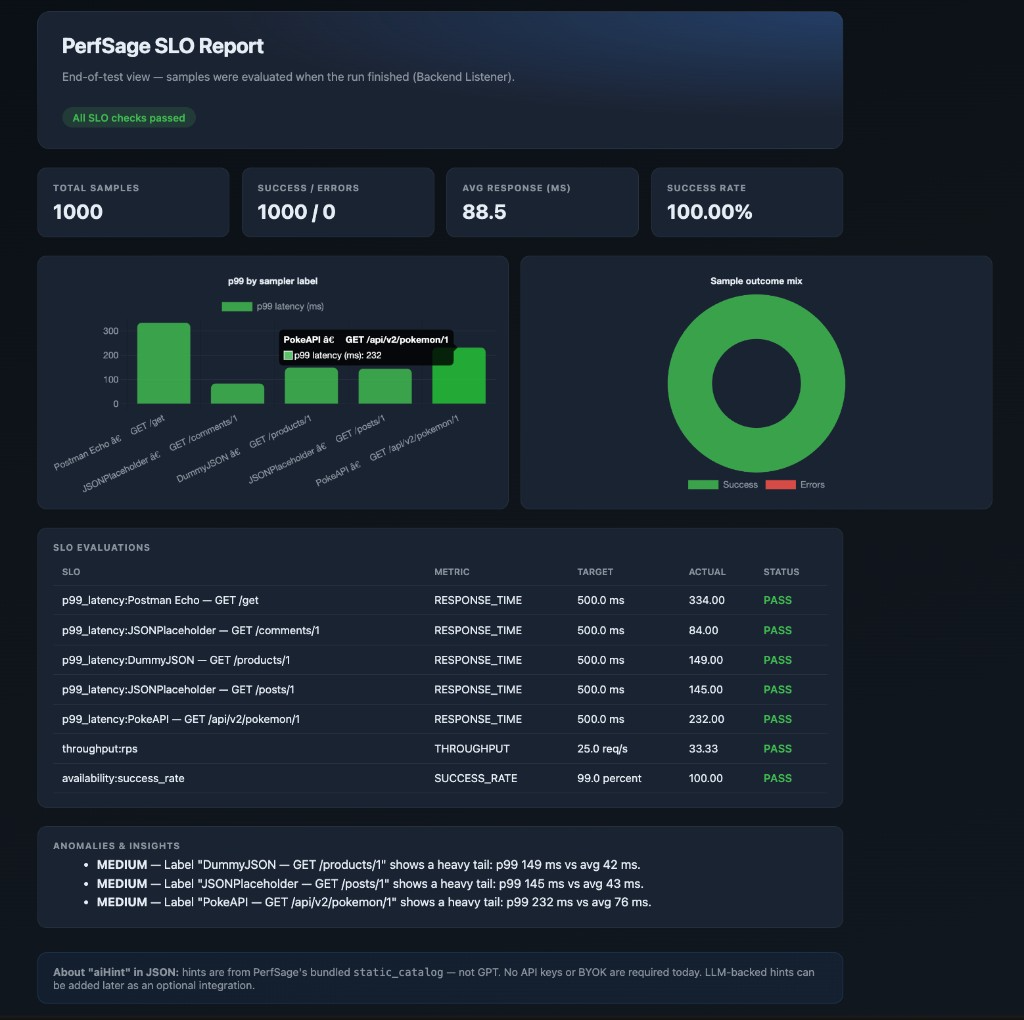
SLO evaluations — every check, every verdict
| SLO Check | Metric | Target | Actual | Status |
|---|---|---|---|---|
p99 — Postman Echo /get | Response Time | 500 ms | 334 ms | PASS |
p99 — JSONPlaceholder /comments/1 | Response Time | 500 ms | 84 ms | PASS |
p99 — DummyJSON /products/1 | Response Time | 500 ms | 149 ms | PASS |
p99 — JSONPlaceholder /posts/1 | Response Time | 500 ms | 145 ms | PASS |
p99 — PokeAPI /api/v2/pokemon/1 | Response Time | 500 ms | 232 ms | PASS |
| Throughput | req/s | 25 req/s | 33.33 req/s | PASS |
| Availability | Success Rate | 99% | 100% | PASS |
What the anomaly section flagged
The report also caught something worth noting: three of the five APIs showed heavy tails — their p99 was significantly higher than their average:
- DummyJSON
GET /products/1— p99: 149 ms vs avg: 42 ms (3.5×) - JSONPlaceholder
GET /posts/1— p99: 145 ms vs avg: 43 ms (3.4×) - PokeAPI
GET /api/v2/pokemon/1— p99: 232 ms vs avg: 76 ms (3.1×)
These were flagged as MEDIUM severity anomalies — not failures, but signals worth investigating in a real system. That’s exactly the kind of insight you normally need a custom script to surface.
The moment that proved it worked
I opened the HTML report and could immediately see:
- A green “All SLO checks passed” banner at the top
- A bar chart of p99 latency by endpoint
- A donut chart showing 100% success rate
- A table with every SLO, target, actual value, and verdict
- Three flagged anomalies with clear explanations
No one needs to know what a .jtl file is. No one needs to understand JMeter’s aggregate report. They just open this, look at the banner, and know: the test passed.
Why this matters
If you have ever been the person stuck between “we use JMeter” and “we need SLO-based go/no-go,” you know the friction.
The usual answer is “write a script.” That script gets written, forgotten, broken, and rewritten — by a different person each time. It owns no home in the codebase, has no tests, and silently fails in subtle ways.
PerfSage SLO Reporter is my attempt to make that script unnecessary. The verdict comes from the run itself. You configure your thresholds once. The report exists in a form you can share, attach, or archive.
Try it
- GitHub: perfsage/perfsage-slo-reporter — install, configuration, and examples
- Product page: /slo-plugin/ — JMeter SLO Reporter plugin overview and FAQ
- Analyze JTLs: /reveal/ — PerfSage Reveal for post-run chart analysis
- Apache JMeter: jmeter.apache.org — the load testing tool this plugin extends
- Book a call: topmate.io/abajpai — if you want help setting up SLO-based performance pipelines
Published: April 2026 · By Aashish Bajpai