
The problem I kept running into
I’ve been a performance engineer long enough to know the rhythm by heart:
- Run a load test in JMeter
- Wait for the HTML report to generate
- Scroll through tables, charts, and percentiles
- Export a screenshot for the stand-up
- Go back to the spreadsheet anyway
JMeter’s built-in HTML report is fine for showing what happened. It’s not built for explaining what it means.
Every time I opened one, I found myself asking the same questions:
| What I saw in the report | What I actually needed |
|---|---|
| p99 latency: 1,124 ms | Is that a tail-latency problem or normal variance? |
| Error rate: 31% | Which endpoint broke, and when did it start? |
| Response time scatter | Are there outliers hiding in one transaction? |
| Green average latency | Would my SLO pass or fail — and why? |
The answers were always somewhere in the data. But getting to them meant manual digging — pivot tables, custom scripts, or asking the one person on the team who remembers how the last project did it.
Analysis produces real value out of performance data. I kept watching teams skip that step because the tooling made it too painful.
Why I decided to build instead of workaround
We’re in an AI era now. That doesn’t mean I wanted another chatbot that hallucinates about your load test.
What I wanted was simpler and harder:
- Take any JMeter result file — the
.jtlyou already have - Surface the patterns a senior perf engineer would look for first
- Present it in a way you can share with people who don’t live in JMeter
So I spent time on the idea, iterated on what “useful analysis” actually looks like in practice, and PerfSage Reveal came out of that.
It’s still early — I’m actively improving it — and I’d genuinely love your feedback if you try it.
See it in action: a real 3-minute load test
To prove this wasn’t just a pretty UI, I ran a short load test against three public APIs — the kind of endpoints every engineer has hit in a tutorial:
/posts/{id}/status/200/zen15 virtual users · 3 minutes · no custom scripts afterward.
I pulled the Docker image, started the container, and uploaded the raw .jtl file. That was the entire workflow.
docker run -d \
  --name perfsage-reveal \
  -p 8000:8000 \
  -v perfsage-reveal-data:/app/data \
  -e PERFSAGE_SECRET="your-32-char-secret-here" \
  aashu3201/reveal:latest
Open http://localhost:8000, drag in your JTL, and wait a few seconds.
What Reveal showed me — without me asking
Here’s the dashboard the moment analysis finished:
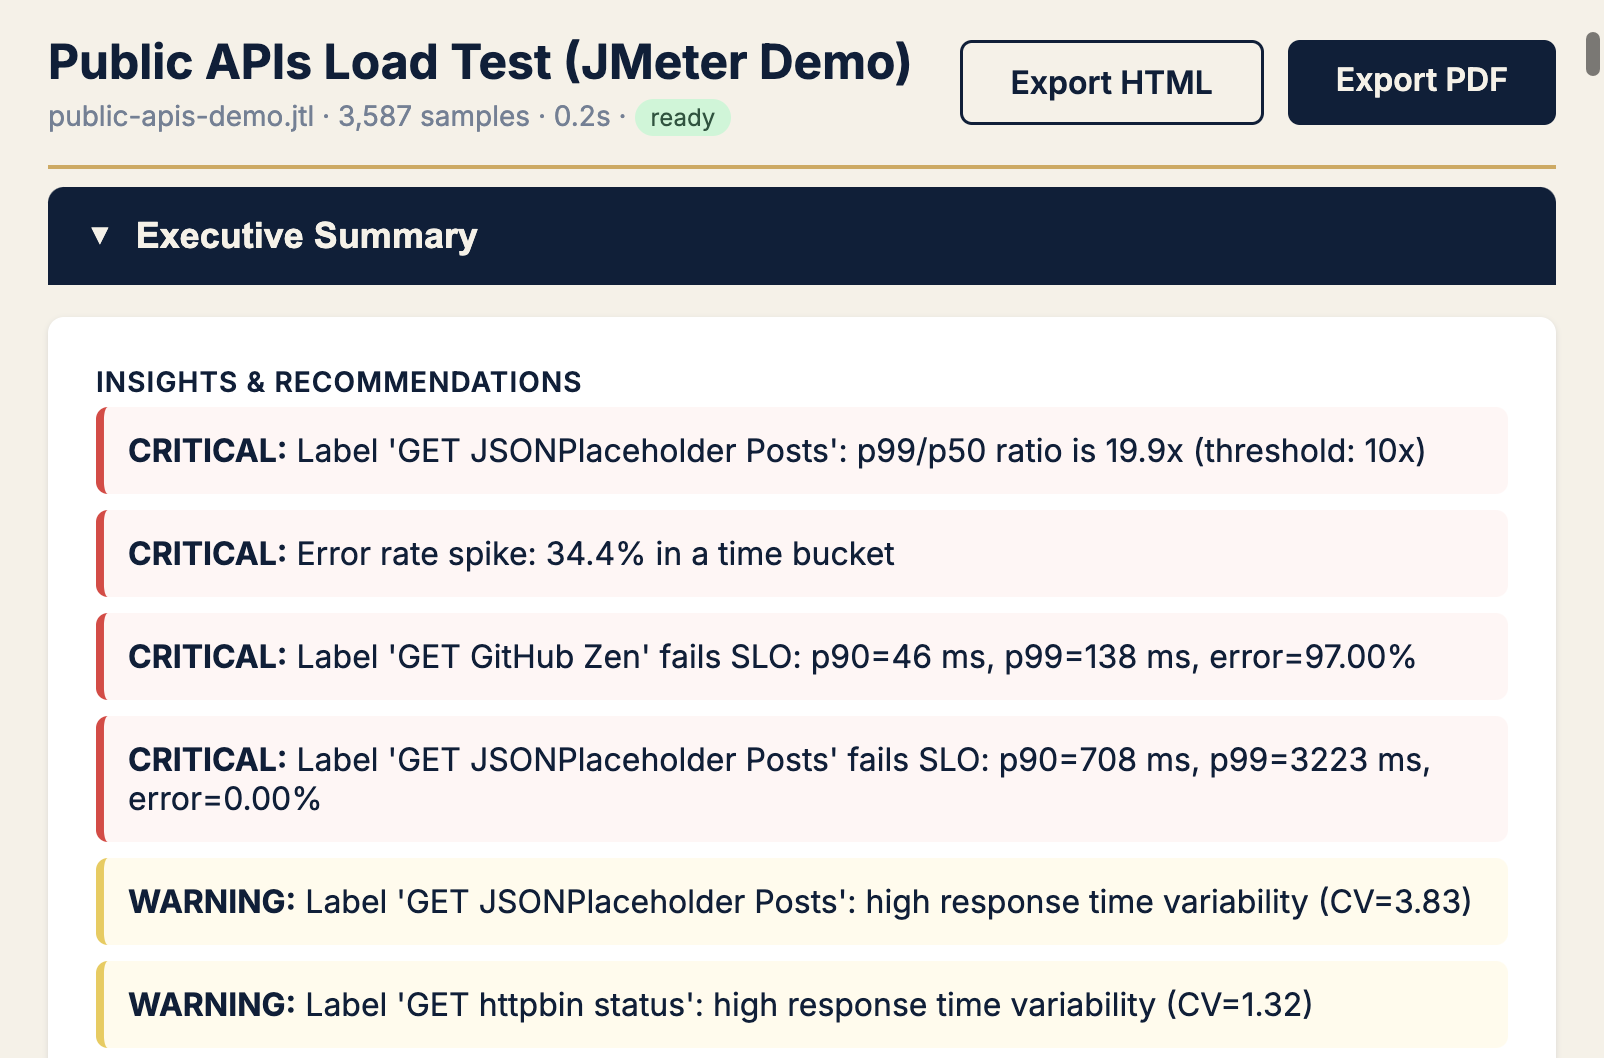
Within seconds, Reveal flagged things I would have spent an hour hunting for:
| Finding | Why it matters |
|---|---|
| Tail latency on JSONPlaceholder — p99 was 19.9× the median | A few slow responses are punishing real users even when averages look fine |
| Error spike — 34.4% failures in one time window | Something broke mid-test, not gradually — worth a timeline look |
GitHub /zen at 97% errors | Rate limiting under load — the test design issue, not a mystery |
The charts that actually help you decide
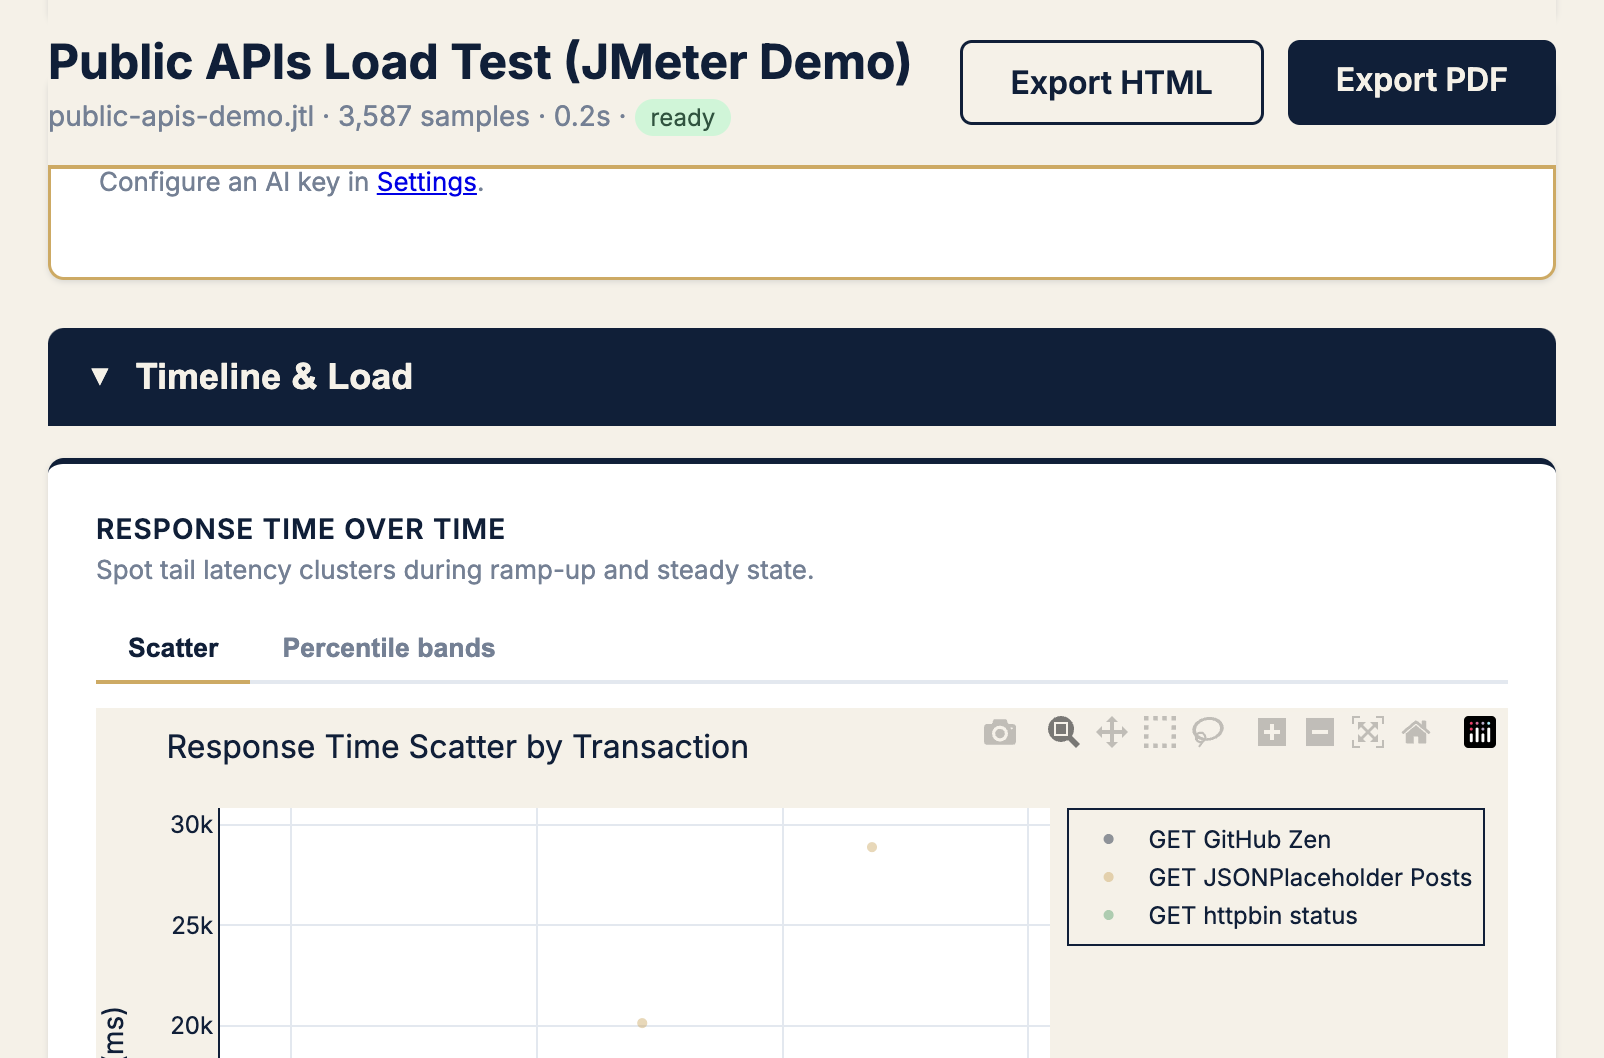
Response time scatter — see outliers per transaction at a glance, not buried in an aggregate table:
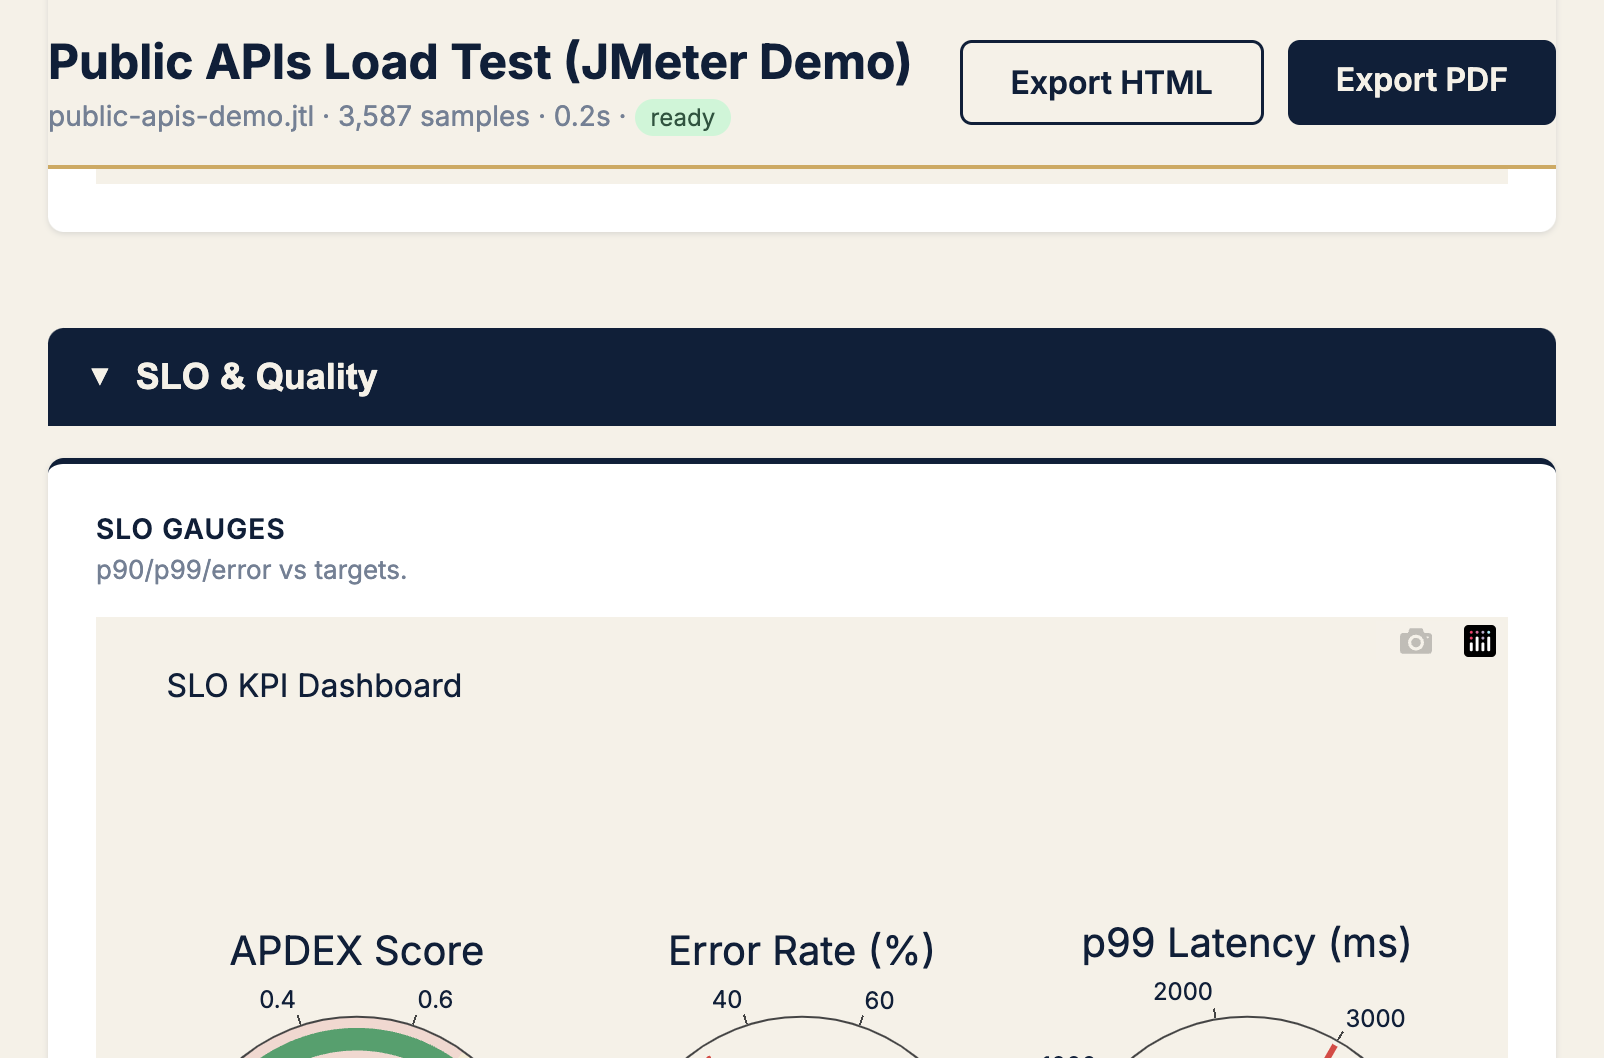
SLO gauges — Apdex, error budget, and p99 compliance in one view:
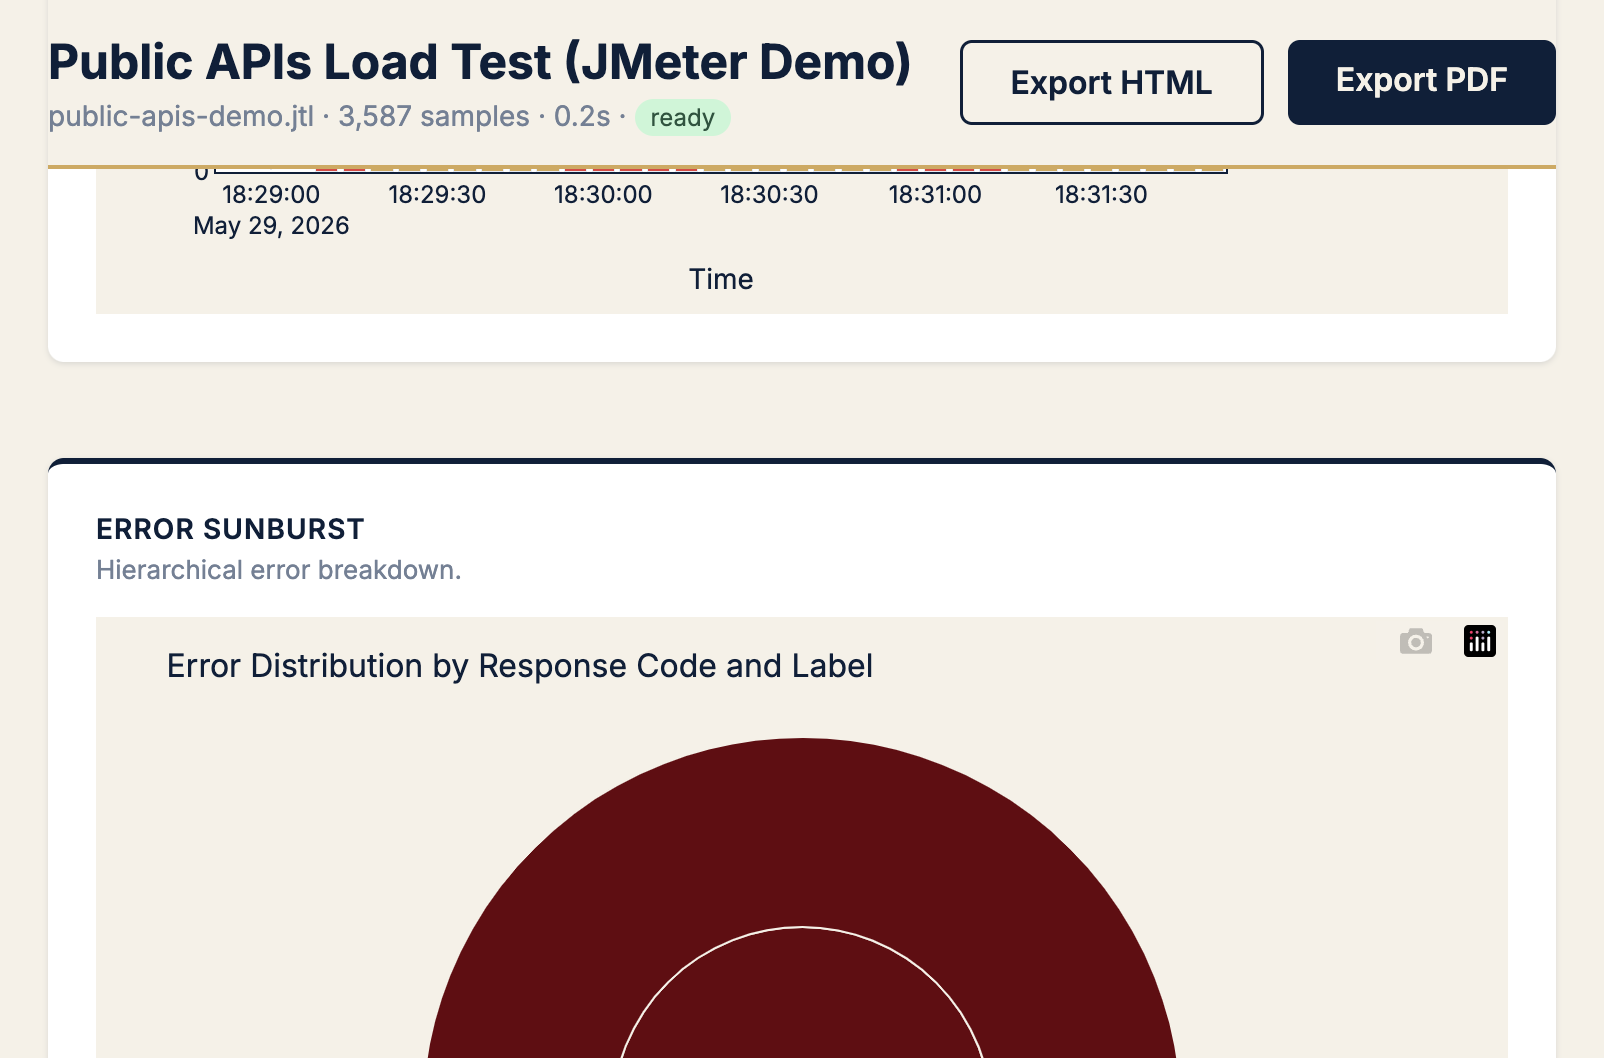
Error breakdown — which endpoint, which failure, how much:
And when I needed something to attach to a review or share with a PM? One-click PDF export — 29 charts embedded, ready to send. No “chart not available” placeholders.
Who this is for
If any of this sounds familiar, Reveal is for you:
- You run JMeter (or inherit JMeter results) and dread the analysis step
- Your stakeholders want answers, not a 40-tab HTML dump
- You care about SLOs but don’t want to rebuild the parsing layer every project
- You want optional AI insights — but only when you’ve configured your own API key
Honest status: early, improving, and open to feedback
PerfSage Reveal is live and usable today — Docker image on Hub, source on GitHub — but I’m treating this as a v0.1 launch, not a finished product.
What’s coming next on my roadmap:
- Richer AI narrative modes and tighter prompt controls
- More JMeter format edge cases from real-world uploads
- Team workflows — compare runs, baseline drift, CI hooks
If you try it and something feels off, missing, or confusing — tell me. Issue on GitHub, DM on LinkedIn, or book a call. That feedback is how this gets better.
Try it yourself
Fastest path — one Docker command:
docker pull aashu3201/reveal:latest

docker run -d \
  --name perfsage-reveal \
  -p 8000:8000 \
  -v perfsage-reveal-data:/app/data \
  -e PERFSAGE_SECRET="change-me-to-a-32-char-random-string" \
  aashu3201/reveal:latest
Then open http://localhost:8000 and upload any JMeter .jtl, .csv, or .xml result file.
- GitHub: github.com/perfsage/reveal — source, issues, and roadmap
- Product page: /reveal/ — JMeter JTL analysis landing with quick start and FAQ
- Docker Hub: hub.docker.com/r/aashu3201/reveal — pull and run
- Book a call: topmate.io/abajpai — if you want help setting up perf analysis pipelines for your team
Published: May 2026 · By Aashish Bajpai