29 expert charts
Scatter, boxplots, CDF, correlation matrix, error sunburst — built for perf engineers.
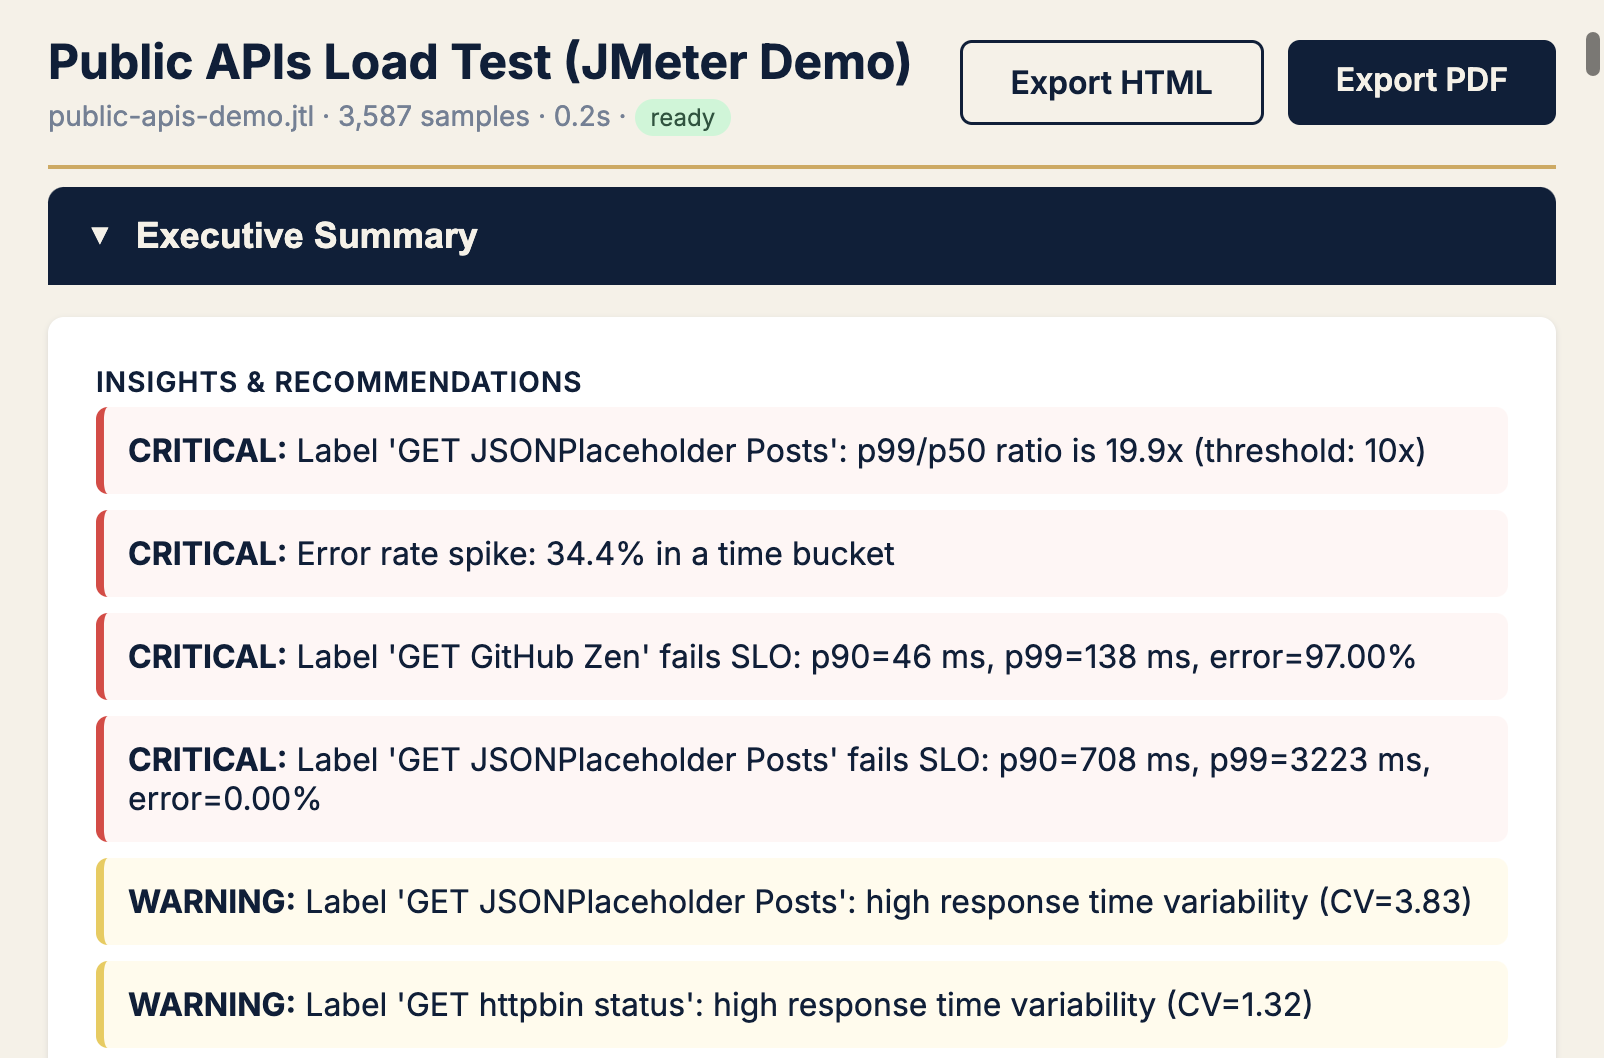
JMeter reports data. Reveal explains what to do next — expert charts, SLO verdicts, tail latency callouts, and plain-English recommendations. One Docker command.
| Symptom | Open first | KPI |
|---|---|---|
| Users say it's slow, average OK | Response time scatter | p99 ÷ median |
| Need release yes/no | SLO gauges + Apdex | SLO verdict, error % |
| Error rate > 0 | Error sunburst | errors by label + status |
| Flaky / inconsistent | IQR outlier scatter | CV, outliers beyond IQR |
| Capacity headroom | RT vs throughput | req/s at knee, p90 at plateau |
Full decision tree in Field Notes #2 — The Reveal Playbook.
Scatter, boxplots, CDF, correlation matrix, error sunburst — built for perf engineers.
Apdex gauges, error budget, p99 compliance — pass/fail before you write the incident doc.
Export HTML and PDF for stand-ups, stakeholders, and archives.
docker pull aashu3201/reveal:latest

docker run -d \
  --name perfsage-reveal \
  -p 8000:8000 \
  -v perfsage-reveal-data:/app/data \
  -e PERFSAGE_SECRET="your-32-char-secret-here" \
  aashu3201/reveal:latest

# Open http://localhost:8000 — upload your .jtlAn open-source JMeter JTL analysis tool. Upload any JTL file and get 29 expert charts, SLO verdicts, smart recommendations, and shareable HTML/PDF reports — one Docker command, no toolchain.
JMeter HTML reports show what happened. Reveal explains what it means — tail latency ratios, error timelines, Apdex, and which chart to open first for your symptom.
Standard JMeter JTL/CSV result files from any test plan. Upload via the web UI or run the Docker container locally.
Yes. Reveal evaluates p95/p99 latency, error rate, and throughput against your targets and surfaces pass/fail verdicts with Apdex gauges.
docker pull aashu3201/reveal:latest, run the container on port 8000, upload your JTL. Full commands on this page and the launch Field Notes post.
Yes — open source on GitHub. For CI gates in pipelines, pair with PerfSage SLO Reporter. For prod RCA after deploy, see SignalPilot.
Load test analysis here; Kubernetes RCA after deploy with SignalPilot.